Module
Twin Model Put on the same map what moves around the site — the trucks and their haul cycle — and what is being built — the dam raise; today over a simulation, with the visualization ready to connect to the operator's position feed.
Fleet in one system, works in the contractor's drawings, facility in another. Where do you see them together?
The problem
What happens today at a facility
The tailings facility does not live apart from the mine: the dam is raised with material hauled by the same trucks that work the pit, and the dam works compete for that fleet. Yet the fleet is watched in one system, the works in the contractor's drawings and the facility in its own. Nobody has a view where you can see, at once, how many trucks are dumping on the dam and how much is left on the reach being filled.
And the dam raise, the most sensitive works on the facility, is tracked through periodic reports: cut and fill, compaction by lot, progress by reach. Reports that arrive late and are hard to compare with one another.
Twin Model, inside Twin Mining TMS, is the visualization of those two things on the same map. It is built and ready to connect to the operator's position feed; today it runs on a simulation, and we say so before anyone asks.
Module · Twin Model
The mine and the facility in the same model.
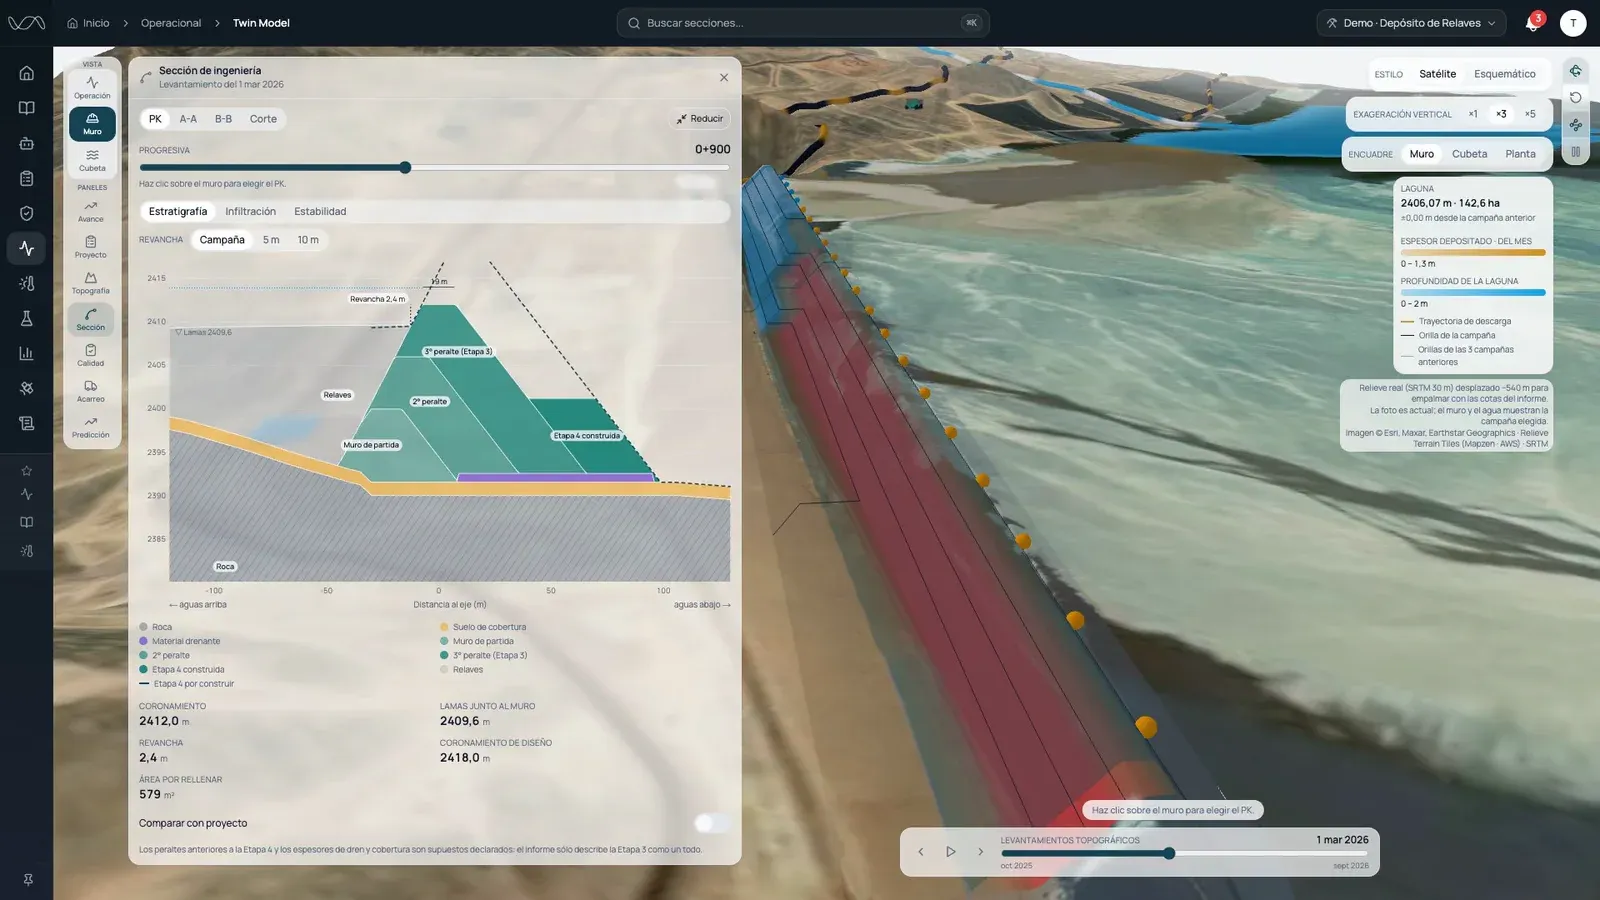
Your facility's digital twin: the site and the dam in 3D on the real relief, the dam's engineering section, the pond and beaches survey by survey, and the fleet in motion.
What it does
Capabilities, with their nuance.
-
The whole site on one map (simulated visualization)
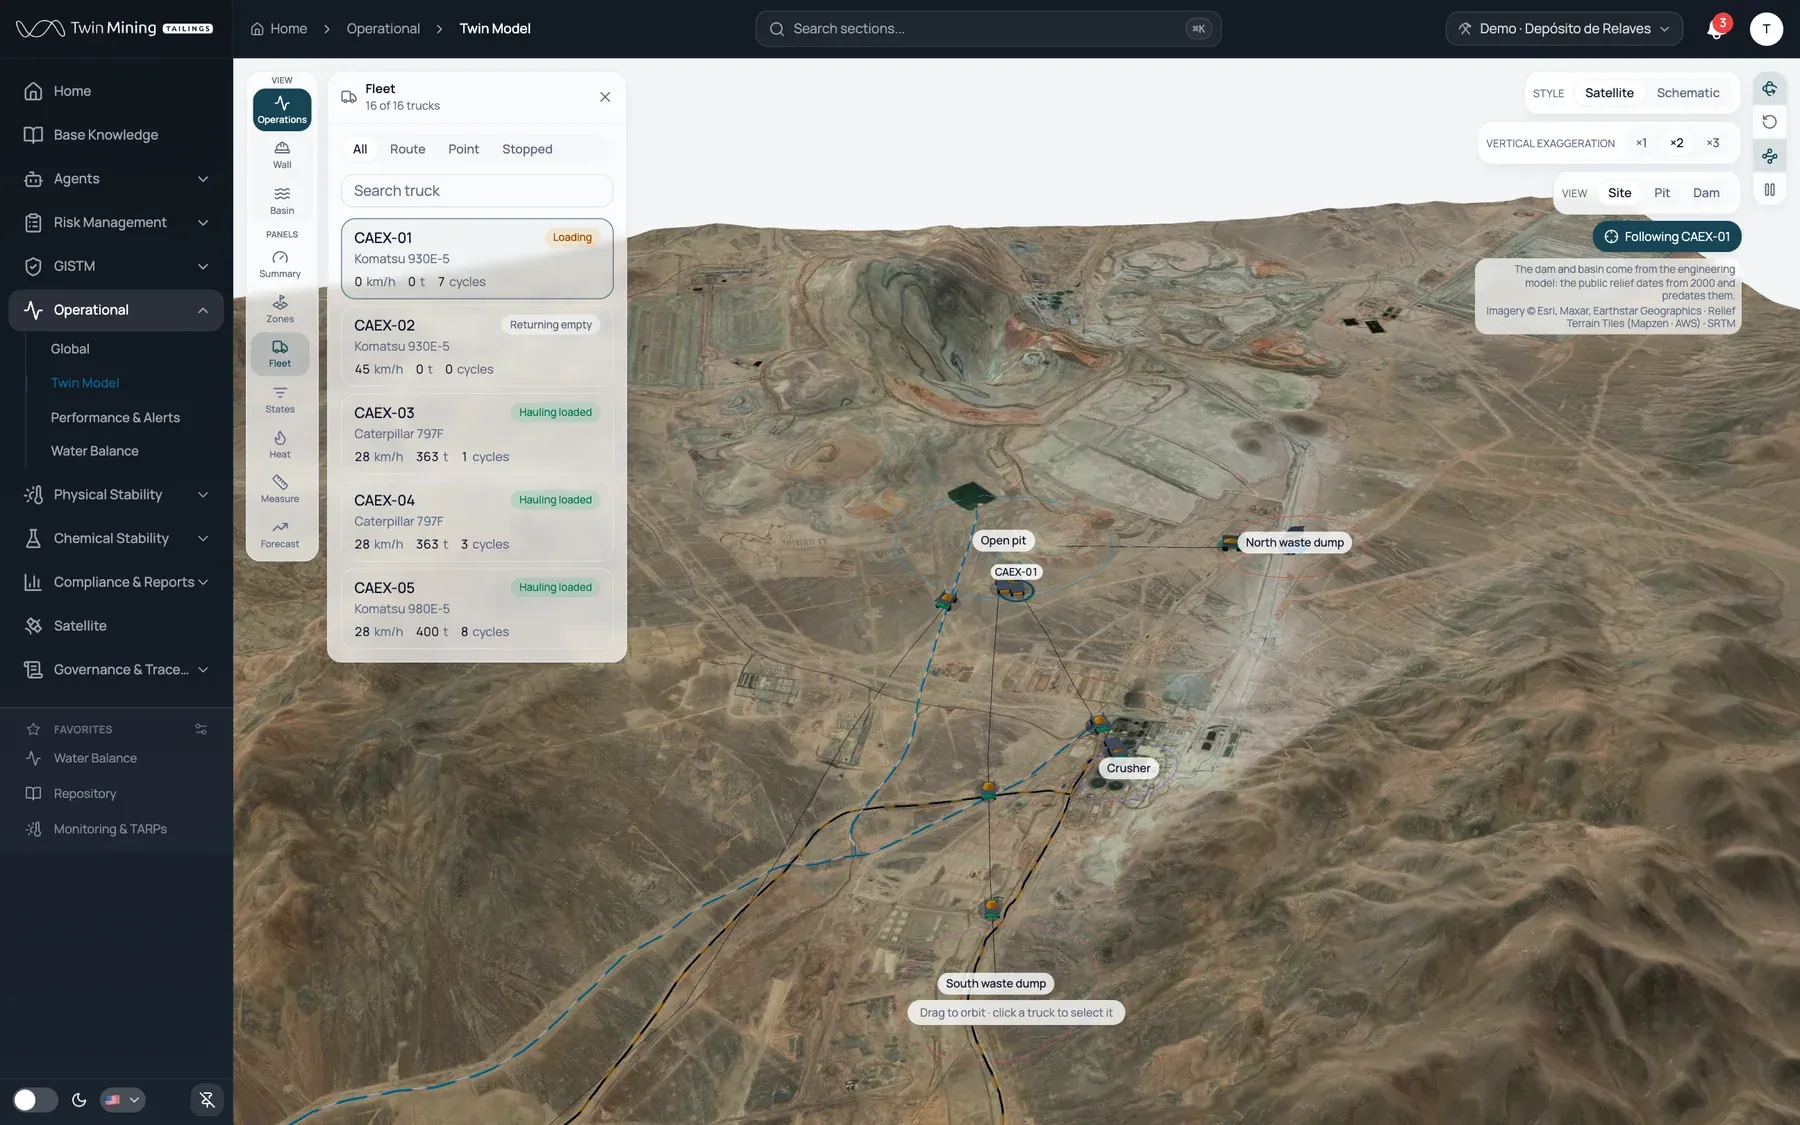
A map of the whole site with the truck fleet, its haul-cycle state — loading, hauling loaded, dumping, hauling empty, stopped — and the shift indicators by site and by zone. Today the fleet is a deterministic simulation: it is shown as a visualization capability, never as a real fleet in operation.
-
The facility geometry is real
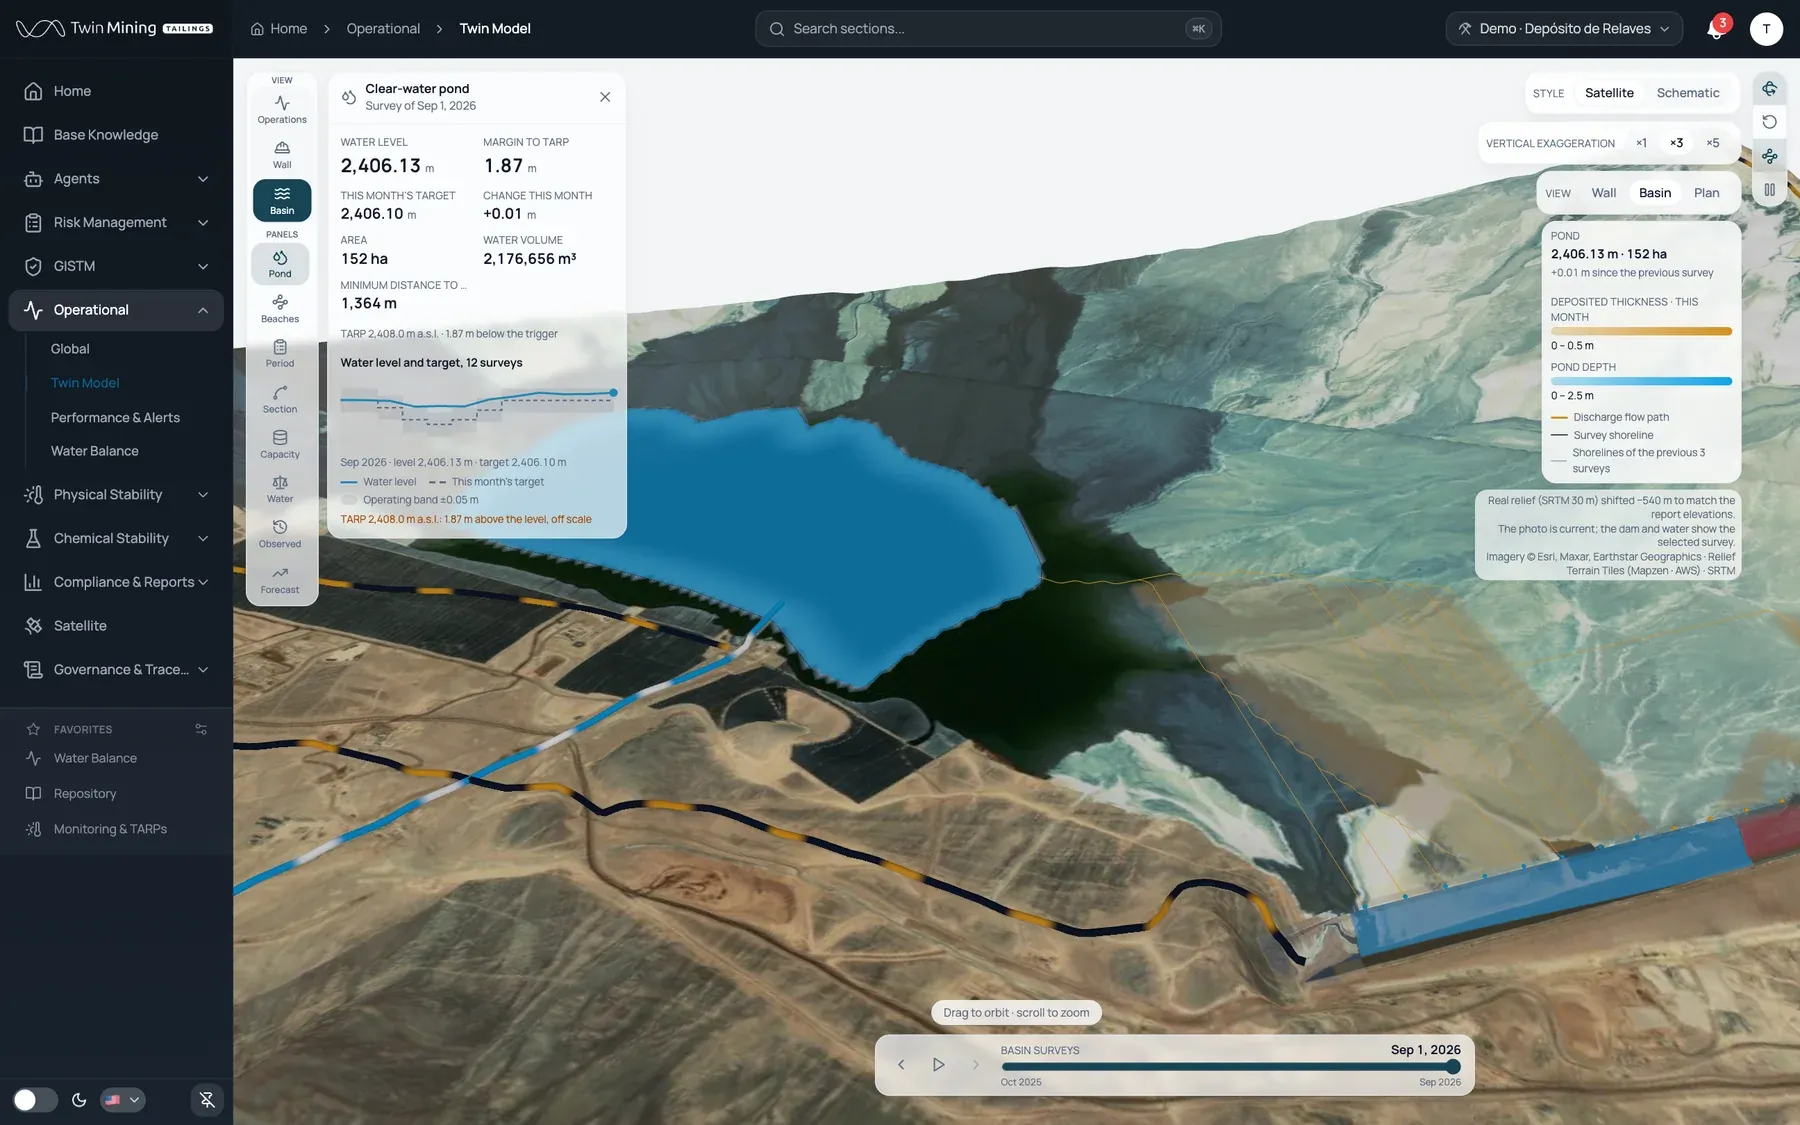
The outline of the dam and the ponds is drawn over the satellite image, generated from the facility survey, not from a sketch.
-
Zone counts with geofences
Each truck is assigned to the zone it is in — pit, crusher, dumps, dam — or left as en route, and the indicators are summed by zone. The facility's dam is one more zone of the site. Over today's simulation, the count is of simulated trucks.
-
The dam raise, walkable in time (simulation)
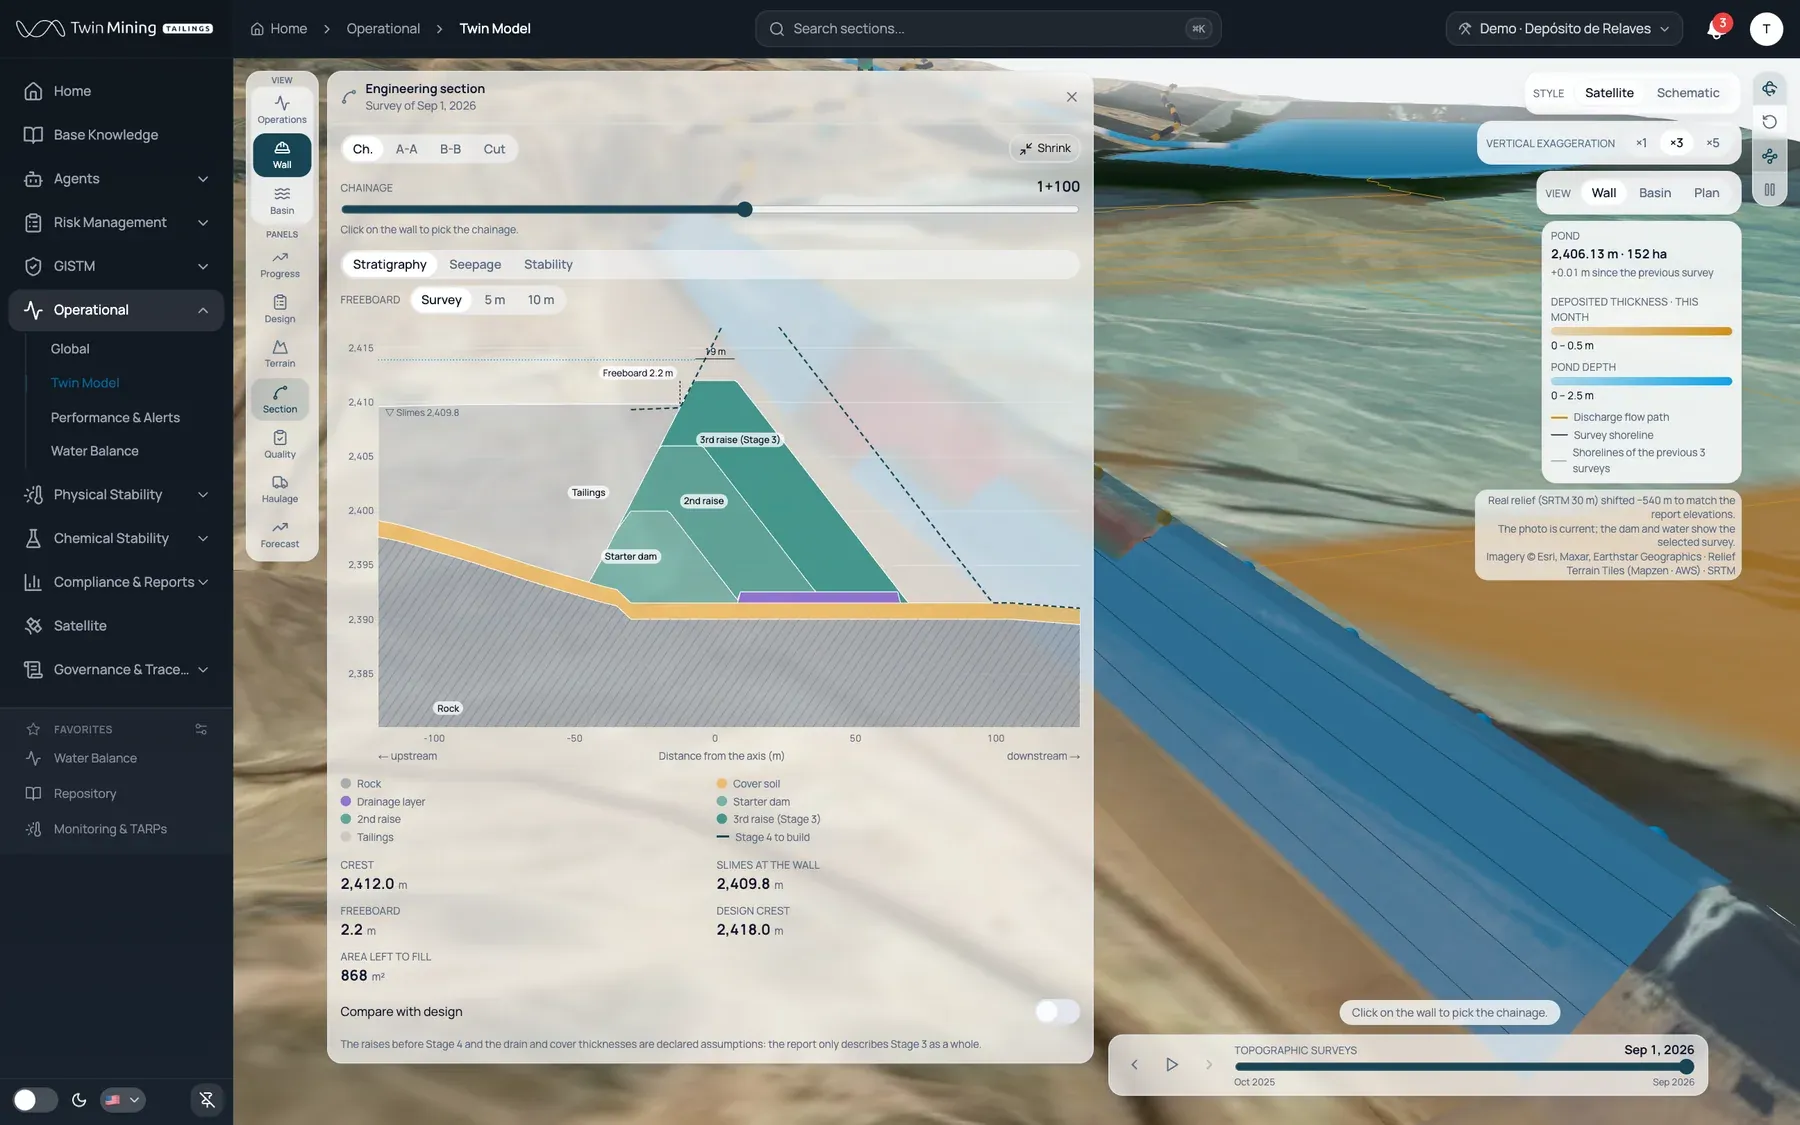
Works view: progress by reach, cut and fill, contour lines, cross profile, compaction control by lot, haulage to the dam and a 3D view, walkable survey by survey. There is no real survey behind it: it is a simulation anchored to the design figures of a raise report. We show the tool, not its numbers.
-
Measurement with an elevation profile
A measuring tool on the map with distance, minimum and maximum elevation, ascent, descent and average slope. It is the only measured value on the screen, and it is worth saying where it comes from: a public 30 m digital elevation model with a vertical error of around ±16 m. Good for a sense of the terrain, not for construction survey.
-
The data source is swappable
The screen consumes a contract and the source — simulated today — is swapped by configuration without touching the interface. The visualization is done; connecting the real position feed does not require redoing it, and it is an integration project.
The facility's dam is built with the same trucks that work the pit. Where do you see both at once?
Scope
What it decides and what it does not
What it works out on its own
It is a read-only surface. The only thing it computes on its own is which zone each truck is in — geofences: pit, crusher, dumps, dam, or en route — and the indicators that come from summing by zone; today, over simulated positions. And the only measured thing on the screen is the elevation profile of the measuring tool, which queries a public 30 m digital elevation model.
What it never decides
It does not dispatch, assign trucks or raise alerts. There is no integration with the operator's position feed: the fleet moving on screen is a deterministic simulation, and the works are a simulation anchored to the design figures of a raise report.
Honesty
What it does not do yet, on purpose.
We would rather say it before the first meeting.
- The fleet is simulated. Everything that moves on screen — trucks, states, shift indicators — comes from a deterministic function of time, and the screen does not say so. That is why every image from this module carries a simulated-visualization caption.
- There is no integration with the operator's position feed, no route history or playback, and no alerts on entering or leaving a zone. The visualization is built and ready to connect; the integration is a project.
- The works are a simulation anchored to design figures. The surveys, the progress and the lots are constructed, and no figure from this screen is published: no tonnes, no cycles, no percentage complete.
- The camera videos in the zone view are stock footage, and their detection labels are demonstration placeholders. The view reserves the spot for existing cameras beside the zone's indicators; nothing more.
- The heat maps have no measurement behind them. We do not talk about them until they have a source.
Who it is for
Who comes in through here
- RTFE — Responsible Tailings Facility Engineer Something crosses a threshold and they find out late.
- Site or shift supervisor A shift that starts without knowing what to look at.
Frequently asked questions
What people usually ask about this module
Short answers with no overclaiming. If something is not built yet, we say so.
Does Twin Model connect to our fleet dispatch system?
Not today. The fleet visualization is built and ready to connect to the operator's position feed; today it runs on a deterministic simulation, and the screen does not say so, so we do. The data layer consumes a contract and the source is swapped by configuration without touching the interface, but the integration is a project, not a checkbox.
Twin Model does not replace a fleet system: it puts what that system already knows next to the facility, with the dam as one more zone of the site. The only measured value on the screen is the elevation profile of the measuring tool, which comes from a public 30 m digital elevation model.
Are the cameras and detection labels shown in Twin Model real?
No. The camera videos in the zone view are stock footage, not from the facility, and the detection labels are demonstration placeholders. The view reserves the spot for existing cameras beside the zone's indicators; nothing more.
The same goes for everything that moves on the screen: the fleet, its states and the shift indicators are a simulation, and the dam works are a simulation anchored to design figures. That is why no Twin Model image is published without a simulated-visualization caption, and no figure from that screen is published.
How are data integrated from instrumentation, sensors, and other systems?
Twin Mining TMS's data layer uses interchangeable adapters per source: the screen consumes a contract and the source — geotechnical and geochemical instrumentation, sensors, corporate systems — is swapped by configuration without touching the interface. There is also an API for integration; there is no write path towards control systems.
Each integration is a piece of work, not a checkbox: source, frequency and units have to be agreed with the operator. We say so up front so nobody arrives at the first meeting expecting an automatic connection.
Integrations are implemented incrementally, source by source, without stopping what already works.
Other modules
What connects with this module.
- Management of Change We know who signed. We don't know what they had in front of them when they signed. That is the problem. See the module →
- GISTM Your GISTM self-assessment is green. When did anyone last open the document that supports it? See the module →
- Knowledge Base "It's in the stability report" is not an answer. "Page 47, revision C" is. See the module →
- Agents It's three in the morning and the ground just shook. Where is the TARP? See the module →
- Operations Your facility's water balance lives in a spreadsheet that only one person understands. See the module →
- Physical Stability The engineer thinks about the dam in section. Monitoring software shows it in plan. See the module →
Request a demonstration
Let's talk about your facility.
Tell us which facility you manage and what keeps you up at night. We will walk you through the demonstration environment with someone from the team, module by module, and tell you frankly what is built and what is not.
- We reply within 24 business hours
- Guided demonstration, tailored to your operation
- No commitment. There is no public price: we talk