Module
Physical Stability Put an instrument's reading, the band that qualifies it and the response that band calls for on the same screen — and let the dam be viewed in section, cross-section by cross-section, the way the engineer thinks about it.
The engineer thinks about the dam in section. Monitoring software shows it in plan.
The problem
What happens today at a facility
A well-instrumented facility produces a great deal of data and very few people interpret it. Piezometers, inclinometers and survey points generate series that someone periodically reviews against a criterion written in a report, in a TARP, somewhere else. The familiar result: the anomalous reading was in the system days before anyone looked at it, because looking required opening the series, remembering the threshold and knowing whom to call.
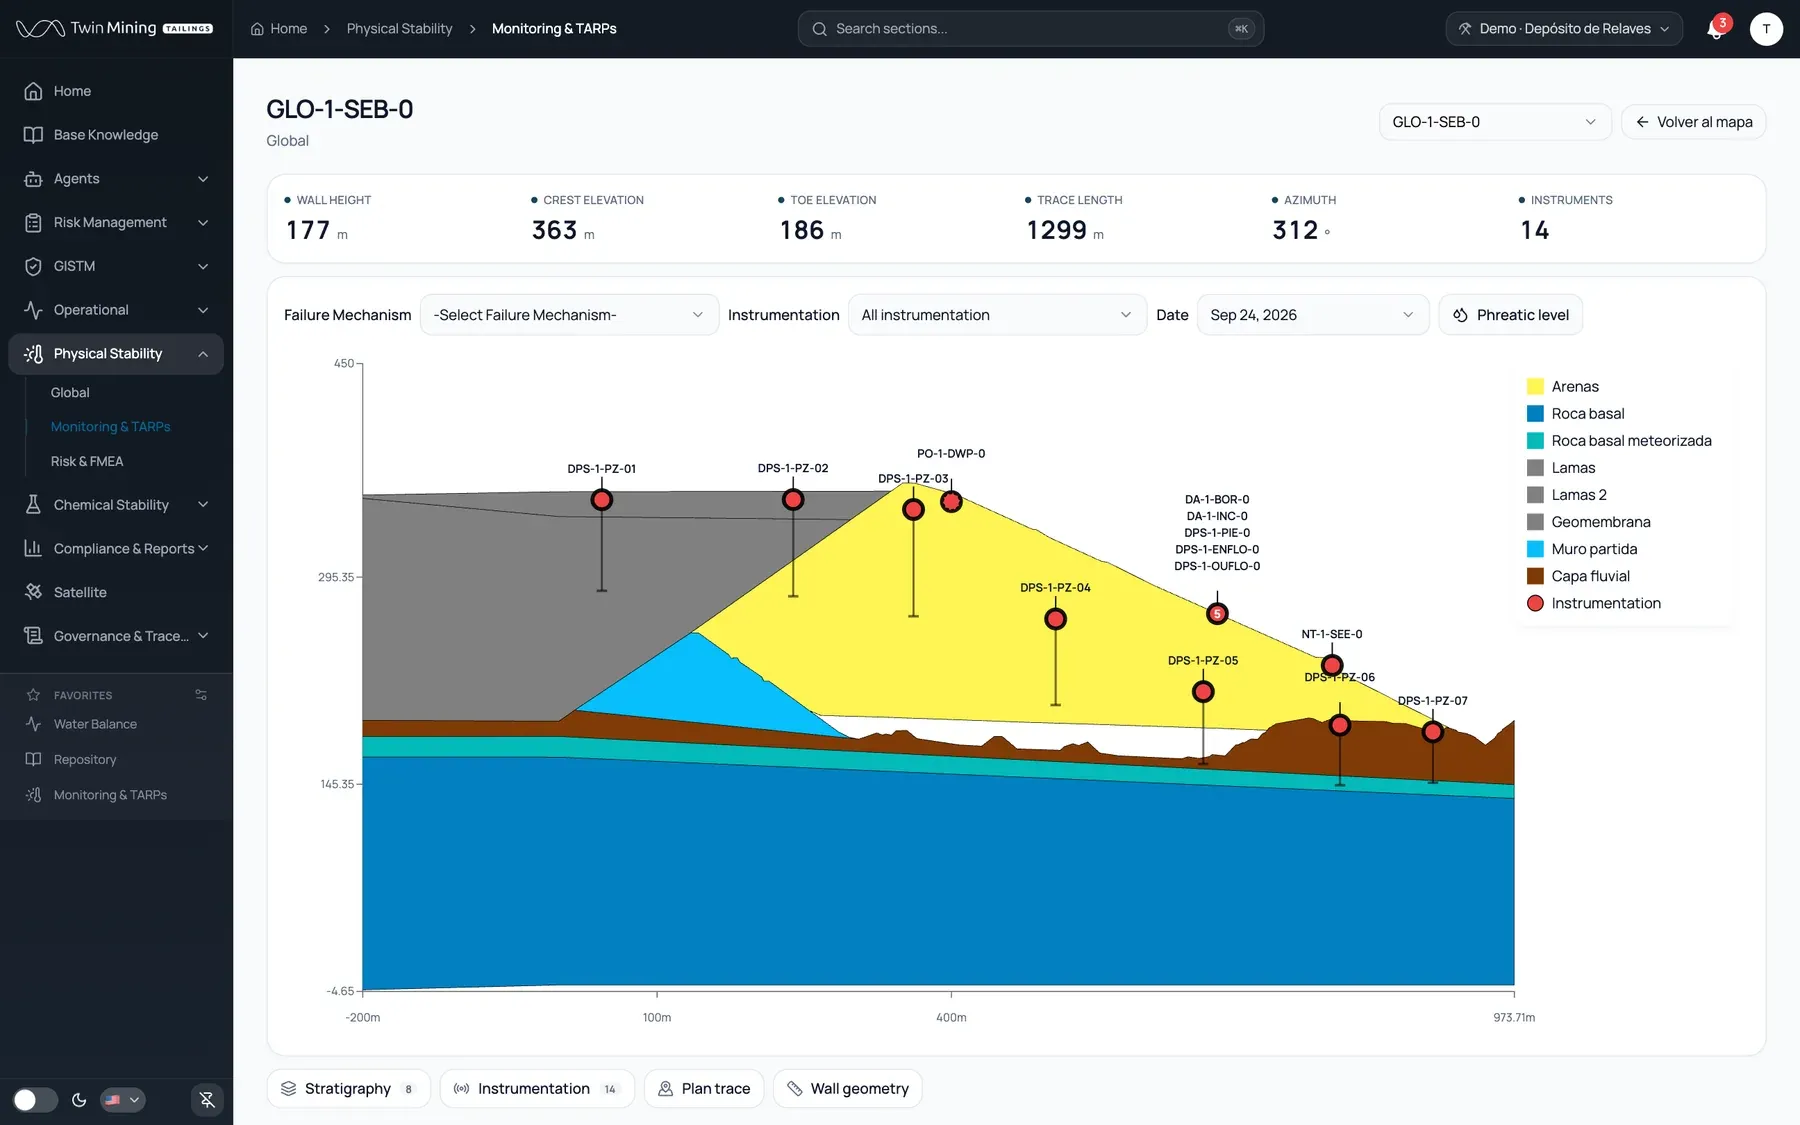
And there is a mismatch of form: the engineer thinks about the dam in section — what lies beneath, how deep the piezometer is, in which stratum — but monitoring software shows it in plan, as points on a map. The section lives in a drawing inside the stability report, separated from the readings.
Twin Mining TMS does not assess stability. It lets you see sooner what was already happening: it shortens the time between a reading changing and someone looking at it, and puts the threshold and the protocol in front of whoever looks, without a search.
What it does
Capabilities, with their nuance.
-
The band travels with the reading
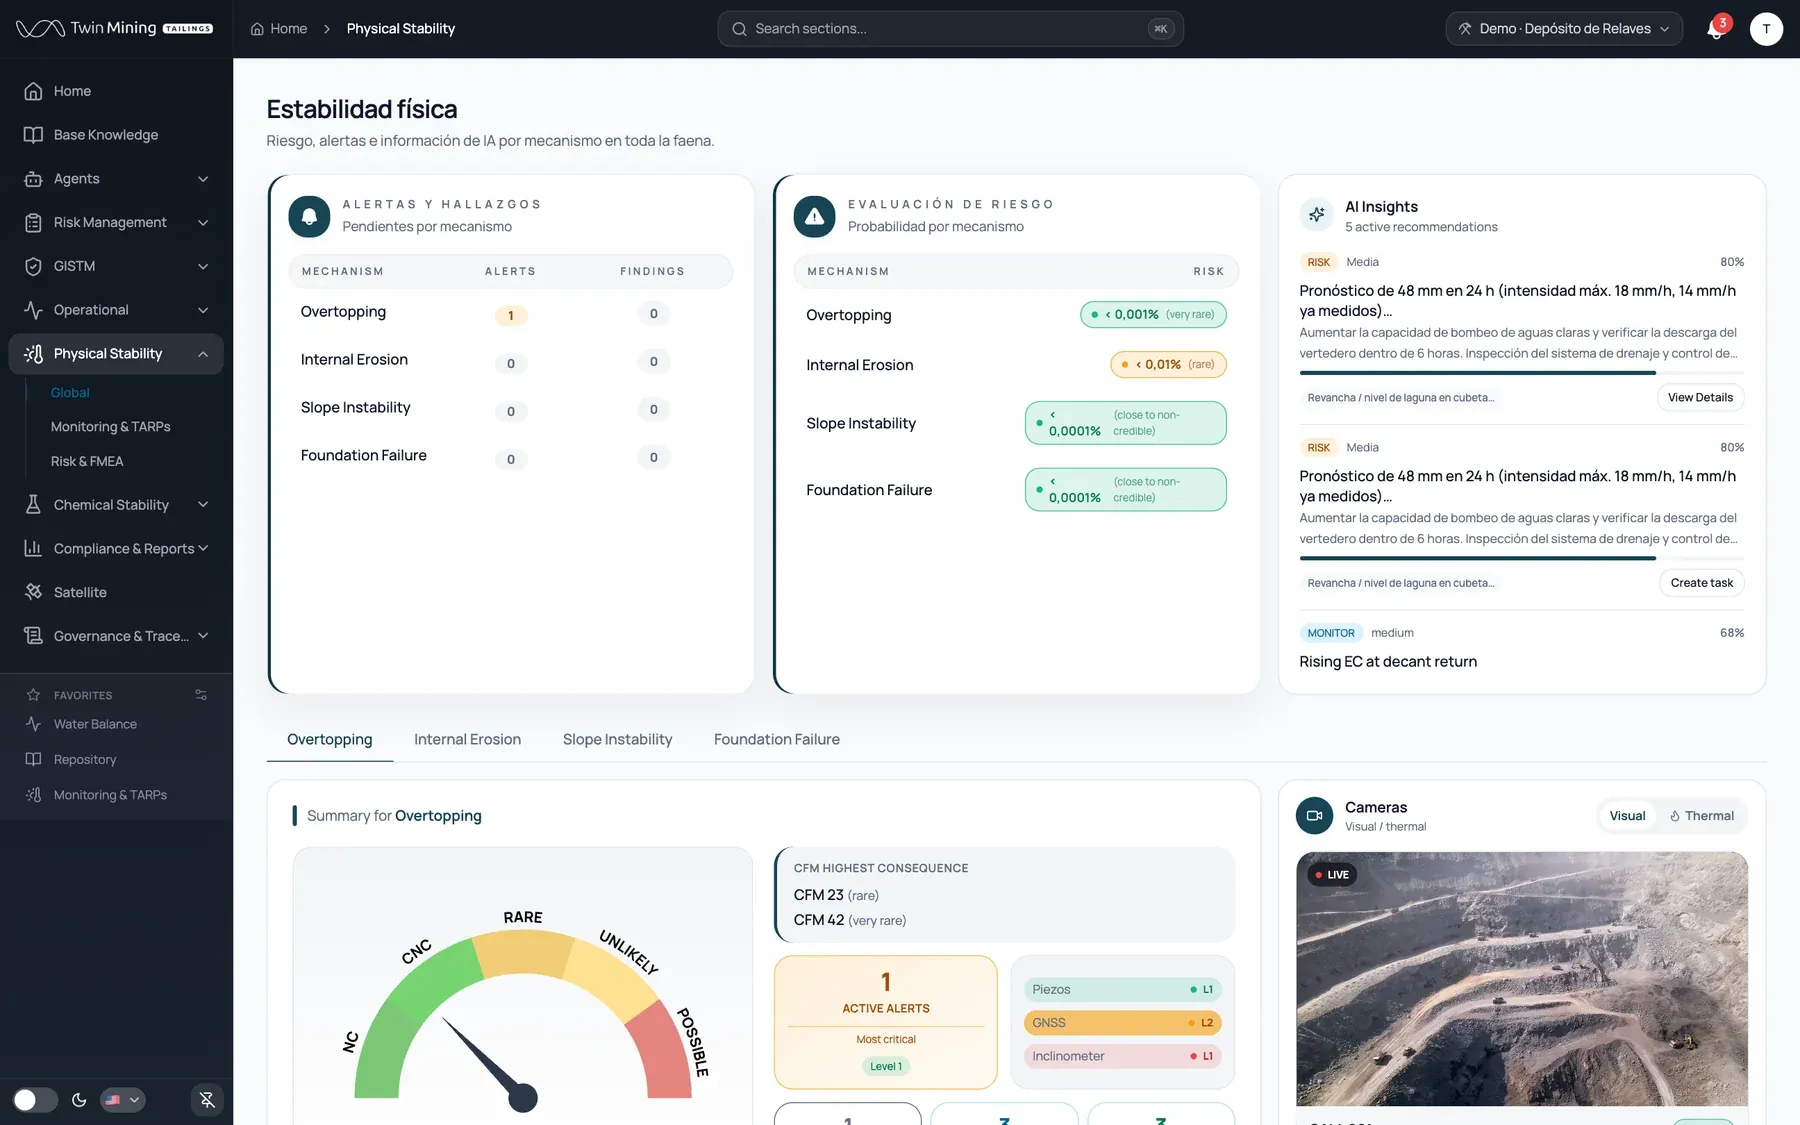
Instrumentation points appear on the facility map coloured by their threshold band, and clicking one opens its time series with the bands drawn over the chart. The state of the whole reads without opening anything.
-
A band crossing takes over the screen
When a sensor crosses a band other than green, the whole application raises a situation overlay with sensors grouped by colour, a severity gauge, the short series and the point's map. It is not a bell-icon notification.
-
Criticality is derived
An instrument is critical when a TARP threshold hangs from it. It is not a box someone ticks: a criticality checkbox maintained by hand stops being true within six months.
-
Risk with the tools of the trade
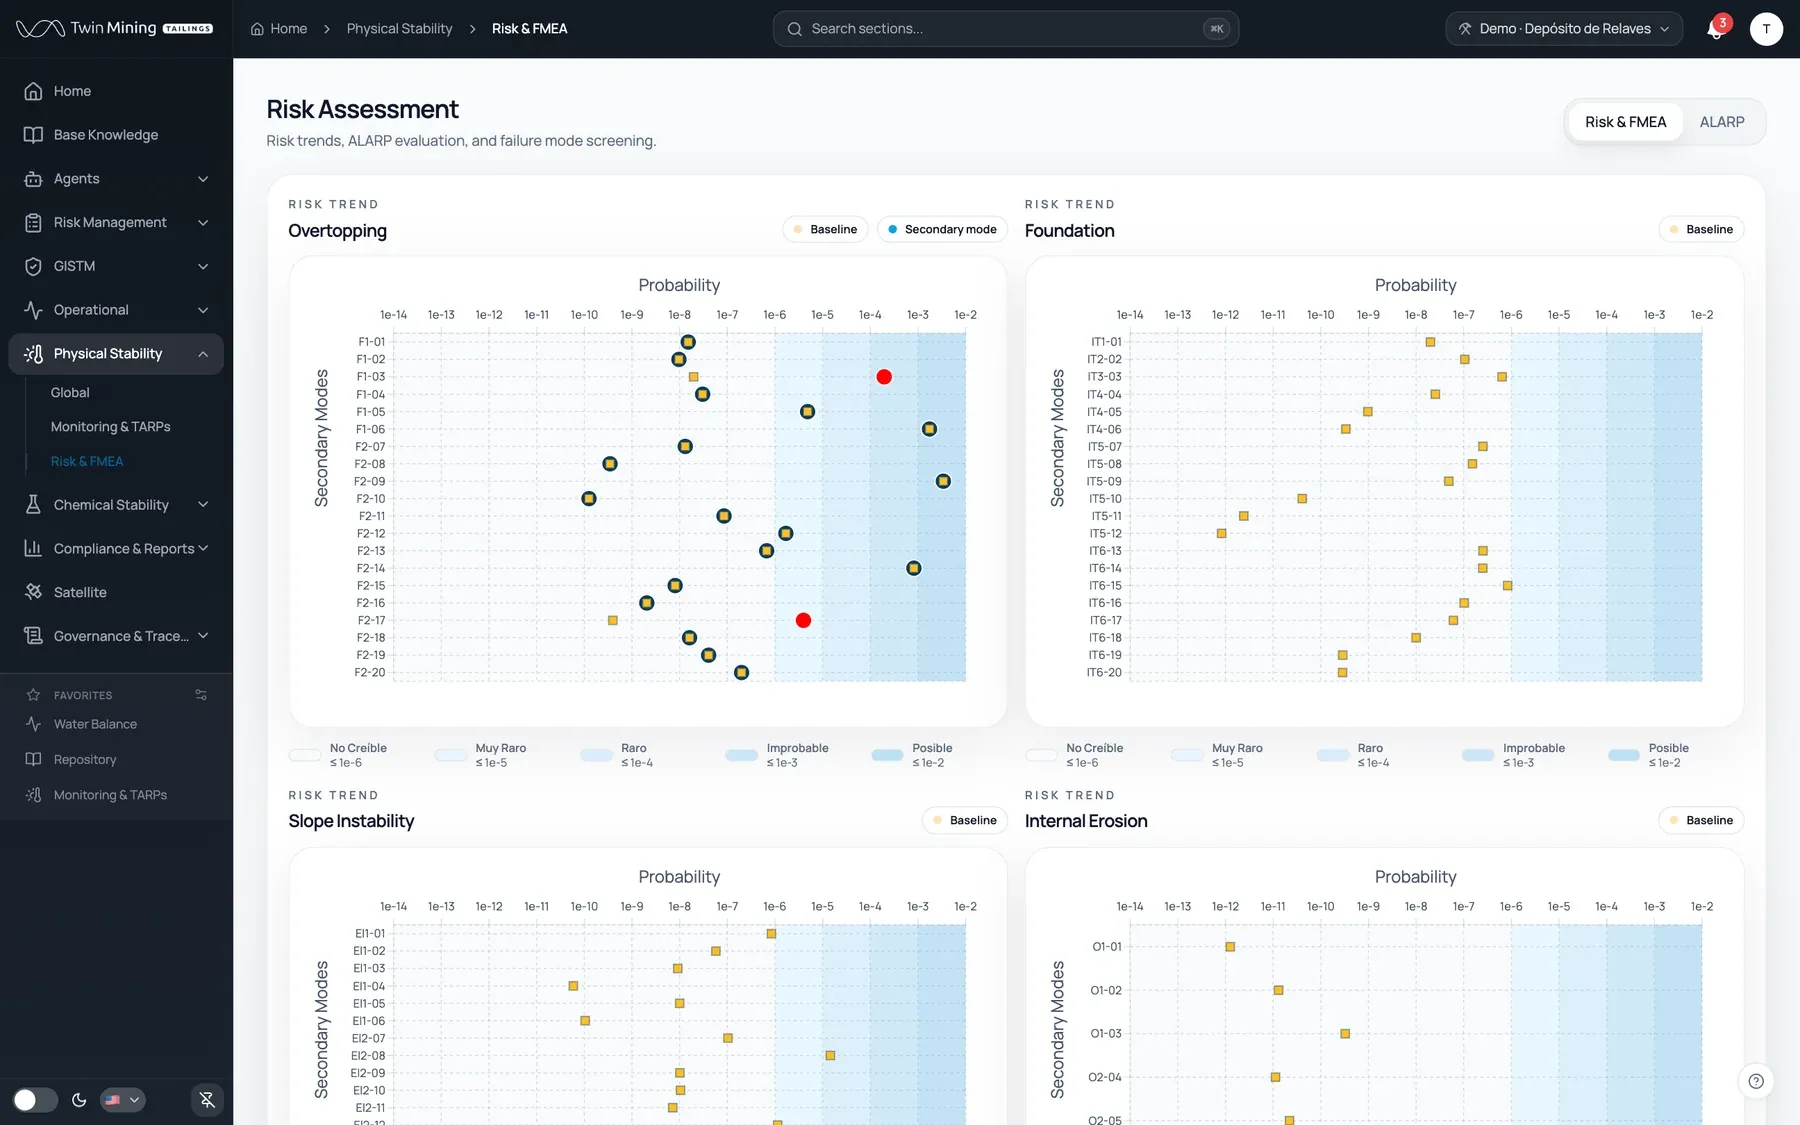
FMEA matrices, bowtie diagrams and the ALARP tolerability chart with its three bands. Not a generic three-by-three colour matrix.
-
The dam is viewed in section
The dam is walked by cross-sections: each has its real trace in plan, its profile by stratum and the instrumentation placed at its chainage along the trace, with the geometry summarized — dam height, crest elevation, toe elevation, length and azimuth. You reach it from the map.
-
A profile by stratum, as a tool
The profile shows the facility's strata — sands, slimes, bedrock, geomembrane, embankment — with the instruments on top. Today it is loaded by hand and at drawing scale, not real elevations, and only two sections have it. What is real is the trace in plan: length, azimuth and endpoints.
-
Filter by instrument family
Instrumentation is filtered by family — piezometers, inclinometers, prisms — on the map, including instruments installed inside a borehole. The prism family is inferred from the displacement variable.
The anomalous reading had been in the system for three days. Looking at it meant opening the series, remembering the threshold and knowing whom to call.
Scope
What it decides and what it does not
What it works out on its own
It shortens the time between a reading changing and someone looking at it. It colours each instrument by its band, raises a situation overlay when a reading crosses a band other than green, and derives an instrument's criticality from the fact that a TARP threshold hangs from it. Judgement remains human; what changes is how long it takes before it can be exercised.
What it never decides
It does not assess stability or compute factors of safety. That is a piece of engineering the Engineer of Record produces with their models, and it lives in the platform as a document in the Knowledge Base. The factor-of-safety panel says "no data source" rather than inventing a number.
Honesty
What it does not do yet, on purpose.
We would rather say it before the first meeting.
- The module does not assess stability, compute factors of safety or anticipate failures. The Engineer of Record does that with their models. The factor-of-safety panel says "no data source": it is where the Engineer of Record's stability model plugs in, not a result.
- The section's phreatic line is a schematic visualization, not a calculation. It does not come from piezometer readings or a seepage model; the figures beside it — gradient, margin — are arithmetic over that curve. The toggle is off by default.
- The piezometers in each cross-section are synthetic, and the screen does not mark them, by product decision. No reading, trend or band on that screen is presented as measured. We show the tool, never what it says.
- Changing a TARP threshold goes through a management-of-change record, and that lock is currently in observe mode: it records the violation, it does not block it. That is deliberate, because every existing threshold predates the module.
- The geotechnical screen, sensors and CCTV exist and are hidden in the demo. They can be mentioned as scope, not shown.
Screens
What it looks like inside
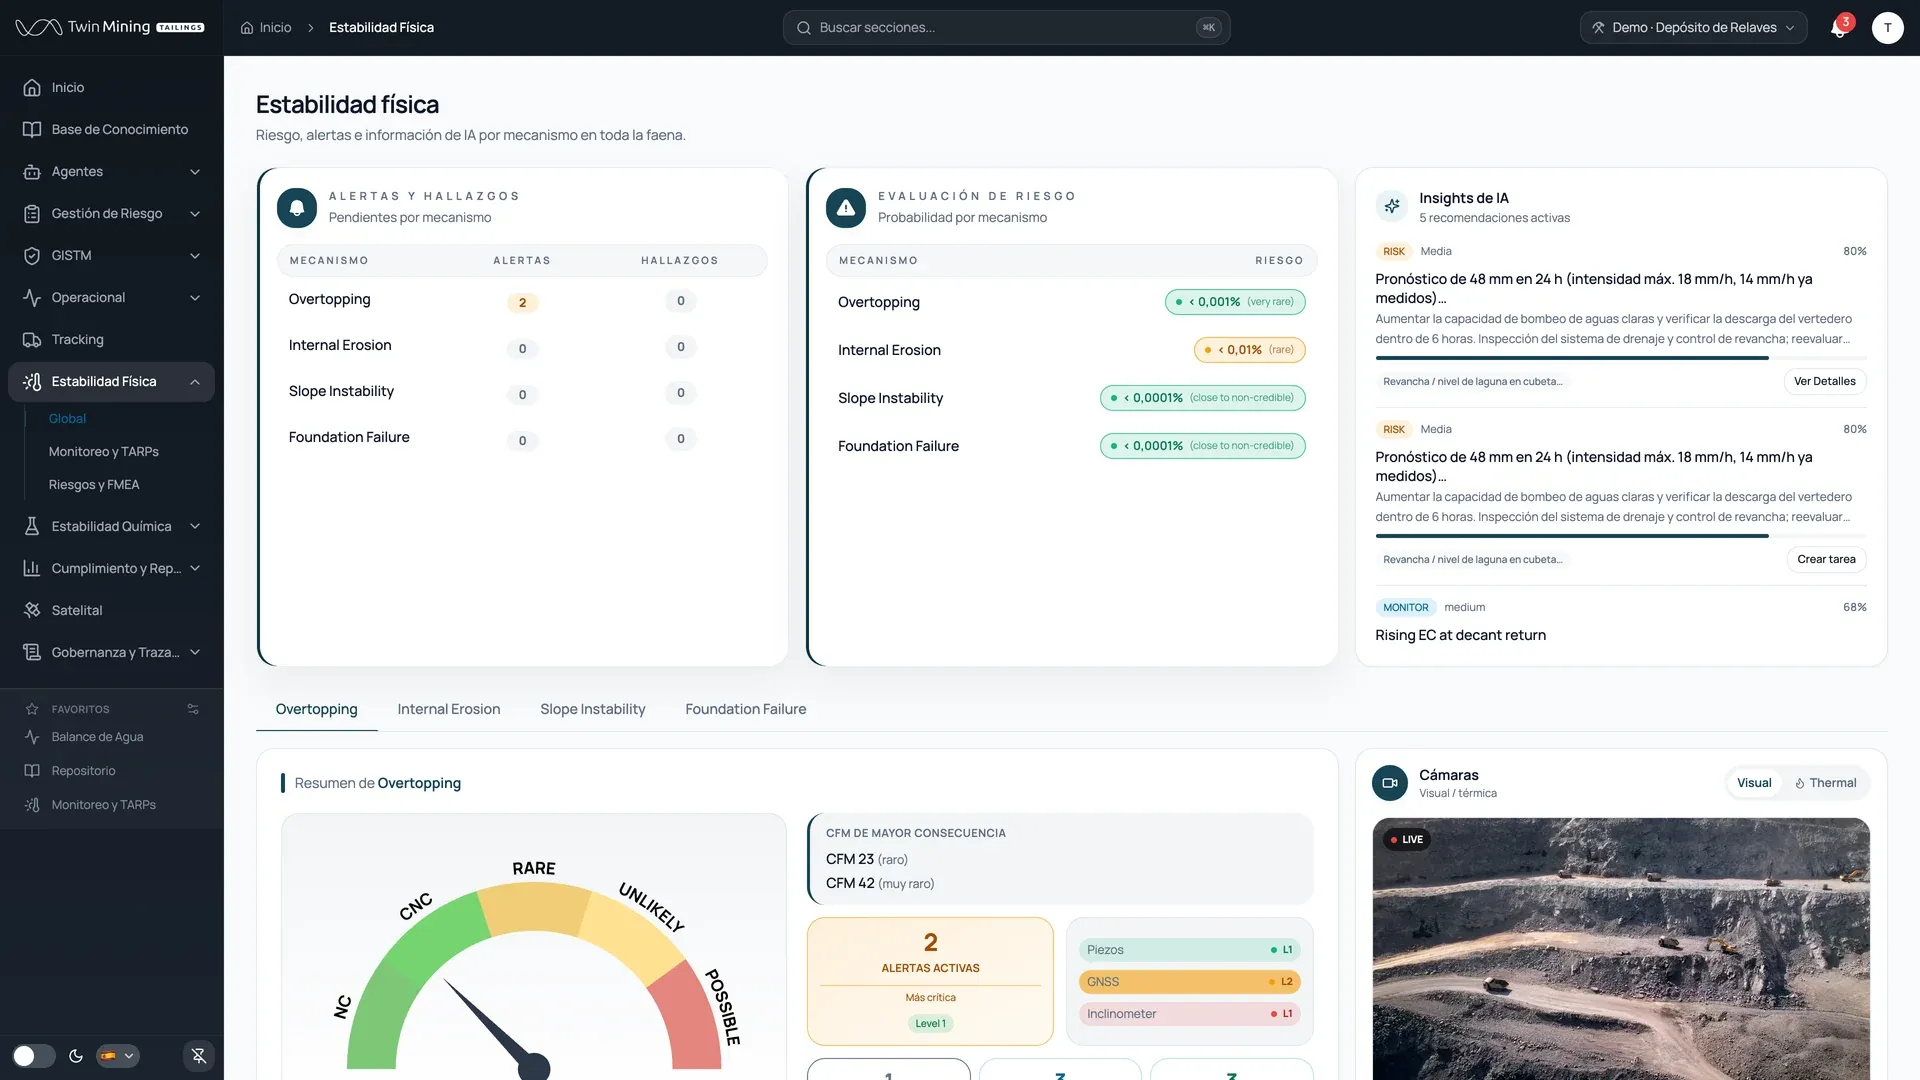
Who it is for
Who comes in through here
- RTFE — Responsible Tailings Facility Engineer Something crosses a threshold and they find out late.
- Engineer of Record Something that compromises their design gets changed without anyone asking them.
- Dam Owner / Accountable Executive The portfolio: which facility is worst off, and why.
- Geotechnical engineer A value they know is written down in some report.
Frequently asked questions
What people usually ask about this module
Short answers with no overclaiming. If something is not built yet, we say so.
Does Twin Mining TMS compute the dam's factor of safety?
No. Stability is assessed by the Engineer of Record with their models, and that analysis lives in the platform as a document in the Knowledge Base. The factor-of-safety panel in each cross-section says, in so many words, "no data source": it is where the Engineer of Record's stability model plugs in, not a result the platform produces.
What the module does is more modest and more useful than it sounds: it puts the instrumentation, its threshold and the protocol's response on the same screen, and shortens the time between a reading changing and someone looking at it. The Engineer of Record keeps saying what they say; what changes is how long their criterion takes to reach the operator's screen.
Are the readings shown in the cross-section from a real facility?
No. Every capture comes from a demonstration environment, and in the cross-section it pays to be especially precise: the trace in plan is real — length, azimuth and endpoints — but the profile by stratum is loaded by hand at drawing scale, the section's piezometers are synthetic, and the phreatic line is a schematic visualization, not a calculation from readings or from a seepage model.
The screen does not mark those piezometers as simulated, by product decision, so we say it ourselves: no reading, trend or band on that screen is presented as measured. What we show is the tool — the navigable section with its stratigraphy and instrumentation — never what it says.
What is a TARP in tailings facility management?
TARP stands for Trigger Action Response Plan. It is the set of threshold bands for an instrument — green, amber, red — together with the response defined for each: which actions are mandatory, who must approve them, and who must be notified.
Explained to someone outside the sector: it is a sensor's traffic light, plus what has to happen when it changes colour.
In Twin Mining TMS the threshold, the response, and the document backing it live on the same screen, and changing a threshold goes through a formal management-of-change record. That last link is what separates a TMS from a monitoring system.
Does Twin Mining TMS predict tailings dam failures or collapses?
No, and it is worth saying plainly: the platform contains no model that predicts the failure of a tailings storage facility. Any vendor claiming otherwise is making a promise an Engineer of Record will take apart in the first technical meeting.
What Twin Mining TMS does do is shorten the time between a reading changing and someone looking at it: thresholds a specialist defined, time series with their bands, anomaly detection over the historical record, and agents that read the facility's documentation and propose with the source cited.
Deciding what a deviation means and what to do about it remains with the accountable people: the RTFE, the EoR, and the site organization.
Other modules
What connects with this module.
- Management of Change We know who signed. We don't know what they had in front of them when they signed. That is the problem. See the module →
- GISTM Your GISTM self-assessment is green. When did anyone last open the document that supports it? See the module →
- Knowledge Base "It's in the stability report" is not an answer. "Page 47, revision C" is. See the module →
- Agents It's three in the morning and the ground just shook. Where is the TARP? See the module →
- Operations Your facility's water balance lives in a spreadsheet that only one person understands. See the module →
- Twin Model Fleet in one system, works in the contractor's drawings, facility in another. Where do you see them together? See the module →
Request a demonstration
Let's talk about your facility.
Tell us which facility you manage and what keeps you up at night. We will walk you through the demonstration environment with someone from the team, module by module, and tell you frankly what is built and what is not.
- We reply within 24 business hours
- Guided demonstration, tailored to your operation
- No commitment. There is no public price: we talk